


Gene Find Project Results
The results? Basically I found out that I have a amazingly high bone density, and that I'm a fat bastard. The results of the scans were presented to me in the form of 4 pages of information. The results from the blood analysis will be emailed to me at a later date.
Page 1: Body Composition
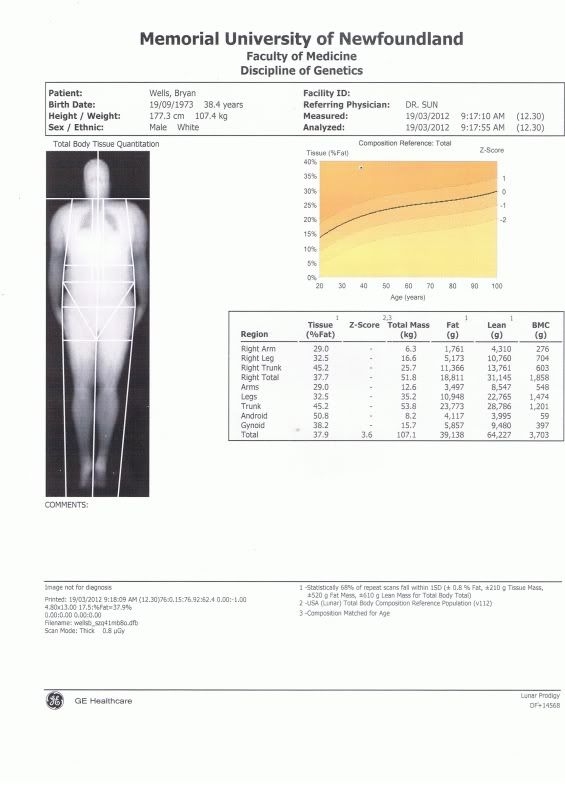
In the above graph the x-axis represents the Body Fat % which ranges from 0% up to 40%. The y-axis represents age in years from 20 to 100.
The "Z - Score" is defined as follows:
Basically The line at zero represents a normal score. The zero line starts at around 14% for someone at the age of 20, and rises to about 27% for someone who is 100. The normal score for someone my age (38yrs old) is about 21%. I however am currently sitting at 37.9%In statistics, a standard score indicates how many standard deviations an observation or datum is above or below the mean. It is a dimensionless quantity derived by subtracting the population mean from an individual raw score and then dividing the difference by the population standard deviation. This conversion process is called standardizing or normalizing; however, "normalizing" can refer to many types of ratios; see normalization (statistics) for more.
Standard scores are also called z-values, z-scores, normal scores, and standardized variables; the use of "Z" is because the normal distribution is also known as the "Z distribution". They are most frequently used to compare a sample to a standard normal deviate (standard normal distribution, with μ = 0 and σ = 1), though they can be defined without assumptions of normality.
The z-score is only defined if one knows the population parameters, as in standardized testing; if one only has a sample set, then the analogous computation with sample mean and sample standard deviation yields the Student's t-statistic.
The chart below the graph gives a detailed account of how my body composition is distributed. My total mass is 107.1 kg, which is comprised of: 39.138 kg of fat, 64.227 kg of lean tissue, and 3.703 kg of BMC (Bone Mineral Content), or more simply bone.
You'll notice that on the left side of the chart if even breaks down the body into different regions and gives you the distribution of total mass, fat, lean tissue, bone, and even body fat % for each region.
Android is defined as follows:
1. of the pelvis : having the angular form and narrow outlet typical of the human male android pelvises>—compare anthropoid, gynecoid, platypelloid
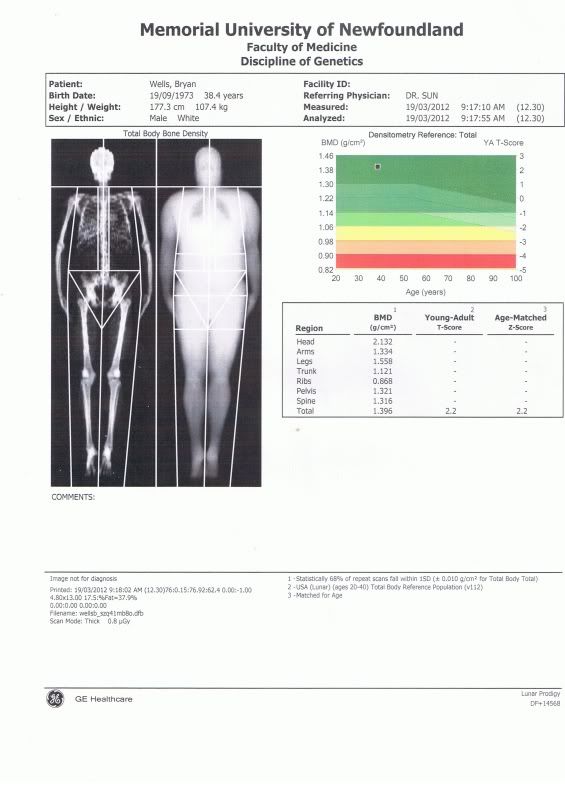
Page 2:

 REMEMBER:
- Remove "A" tags from images.
- Remove cursor pointer code from images
- Add target="_blank" to all links
- Add Center tags to video's
- Add Labels to the post
- Delete this list :)
Labels: About Me, Announcements
![]()


0 Comments:
Post a Comment
<< Home